
Sample report · Veterinary Care
Veterinary Labor Market Data
A diligence-style capability assessment
Structured as answers to the nine questions a diligence buyer actually asks. The archive is collected point-in-time with first-seen and last-seen dates on every posting, 452,000+ unique US veterinarian postings since 2022, and honest caveats stated in place: how long a posting stayed open is approximated from its observation window, not verified against the source, and turnover is a proxy, not a measurement.
Veterinarian postings
452K+
unique, since 2022
US clinic locations
32,060
27,383 marked operational
Median posted vet salary
$145K
2026 YTD, annualized
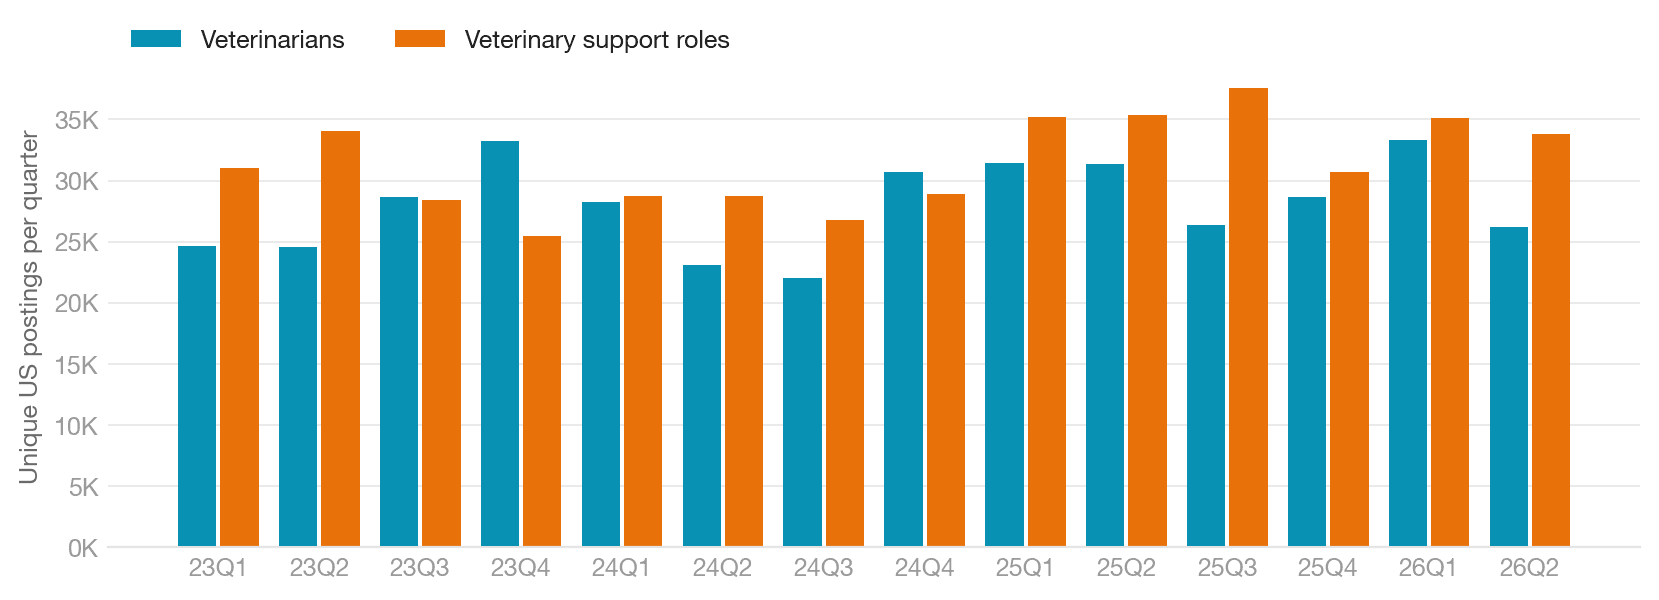
Unique US postings per quarter, veterinarians vs support roles
Annual unique US postings
| Year | Veterinarians | Support roles |
|---|---|---|
| 2022 | 60,091 | 94,575 |
| 2023 | 111,040 | 118,976 |
| 2024 | 104,083 | 113,168 |
| 2025 | 117,820 | 138,906 |
| 2026 (H1) | 59,535 | 68,943 |
Inside the full report
- Point-in-time collection evidence: multi-sighting rates and closed-and-retained shares by cohort
- Posting duration as an approximation: single-posting vs duplicate-cluster bases, stated caveats
- Chronic re-posting: 8,893 employer-location-role slots with 3+ postings in 2024
- Posted salary by role and state, and an operator benchmark table (Banfield, VCA, NVA, and more)
July 2026 archive snapshot. Figures are unique US postings after two-stage semantic deduplication.
Want this analysis for your markets?
The same measurement runs at metro, state, or single-employer grain, for any occupation or industry in the archive. We deliver sample extracts with full history so your team can validate the collection properties directly.