
Sample report · Healthcare & Nursing
Registered Nursing
Reading RN demand through the travel staffing machine
Nursing is the largest and most distorted labor market in posting data: staffing platforms and aggregators generate most of the 46 million RN postings since 2022, with a single travel platform accounting for over 8 million. This report shows the classified view. Contract and travel postings peaked at 81% of RN volume in late 2024 and retreated to 69%, while direct employers rotated incentives: signing-bonus mentions halved as shift-differential mentions doubled.
RN postings
46M+
unique, since 2022
Contract share at peak
81%
of RN postings, Q4 2024
Direct-employer postings
7.7M
hospitals + providers, since 2022
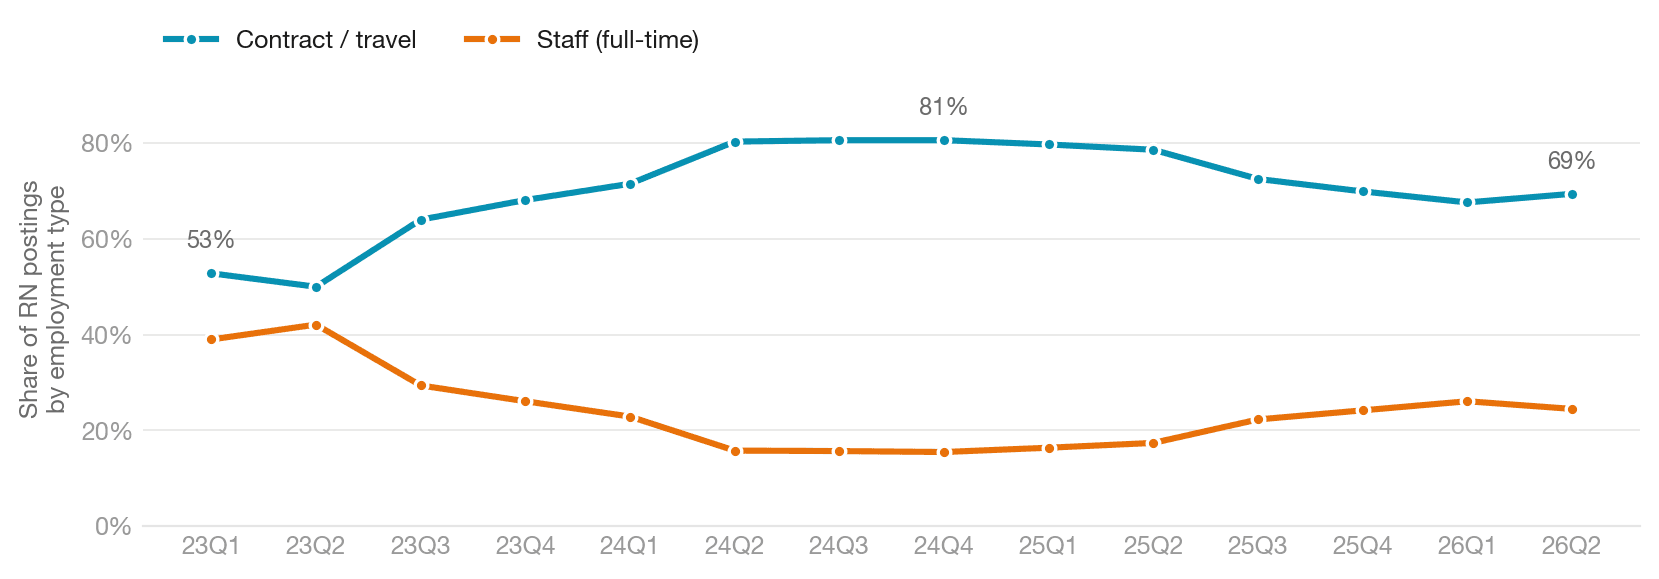
Contract vs staff share of RN postings per quarter
The direct-employer view
| Year | Direct RN postings | Signing bonus | Shift differential | Median posted pay |
|---|---|---|---|---|
| 2022 | 1,662,313 | 23.5% | 3.7% | $79,040 |
| 2023 | 1,926,775 | 20.0% | 4.9% | $83,916 |
| 2024 | 1,576,393 | 16.7% | 6.8% | $86,320 |
| 2025 | 3,218,097 | 15.0% | 8.5% | $84,548 |
| 2026 (H1) | 985,597 | 11.2% | 7.1% | $93,839 |
Deduplicated posting instances from classified direct employers. Roles re-posted over time or posted per shift and unit count once per posting.
Inside the full report
- Why raw nursing counts mislead: advertiser mix by year (staffing, aggregators, direct employers)
- The travel cycle: contract share of RN postings, quarter by quarter
- The direct-employer series: incentive rotation from signing bonuses to shift differentials
- Top hospital systems by RN postings and state-level posted pay
July 2026 archive snapshot. Figures are unique US postings after two-stage semantic deduplication.
Want this analysis for your markets?
The same measurement runs at metro, state, or single-employer grain, for any occupation or industry in the archive. We deliver sample extracts with full history so your team can validate the collection properties directly.